Top 500 YouTube Channels Statistics
Welcome to my website, analysing data of YouTube

MAT 327
Statistical Inference
THE DATA

"The dataset contains the top 5000 rankings of the YouTube channels by a company named Socialblade. The data contains various information on the YouTube channels such as: the Socialblade channel rankings, the grades granted by Socialblade, the YouTube channel name, the number of videos uploaded by the channel, total number of subscribers on the channel and the total number of views on all the video content by the channel." -Kaggle.com. I will be using the first 500 ranked videos data
QUESTIONS
-
 1.
1.
Does more videos published means more views? -
2.
Does more videos published means more subcribers? -
3.
Does the increase in views increase subcriptions? how much? -
4.
Is the highest rated youtube channel the more popular in views and subscribers? -
5.
Why channels with few videos are so popular?
Mean:
-
 Video views:
3870224988 -
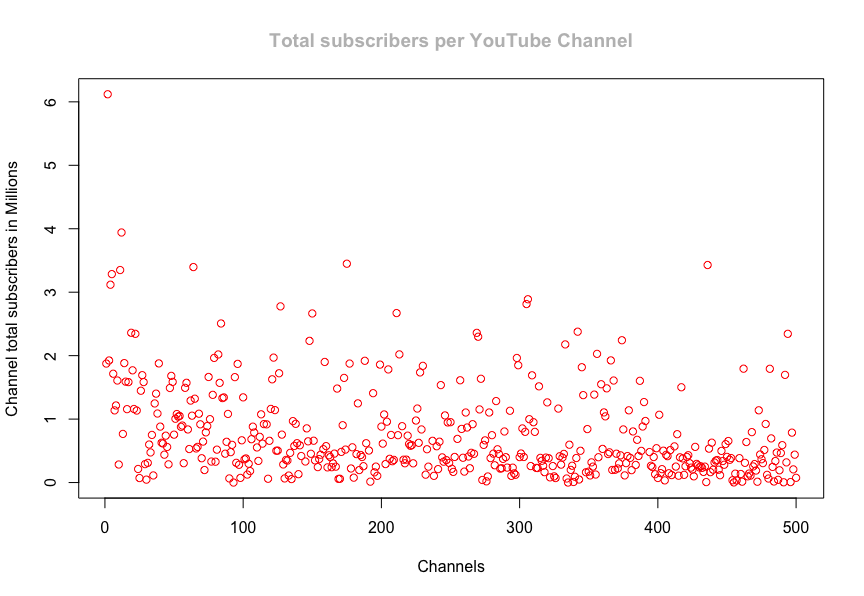
Subscribers:
7529789 -
Video uploads:
7555.936
Standart Deviation:
-
 Video views:
4637487765 -
Subscribers:
7323683 -
Video uploads:
23255.81
The top 500 youtube channels have over 3 billion Views with over 7 Million Subscribers and an average of 7555.937 Total videos uploaded during the life of the channel. The standart deviation calculation in all data sets means that the values in the set are farther away from the mean on average. It reflects a large amount of variation in the set.
Video Views
Video Uploads
Subscribers
PARETO CHART
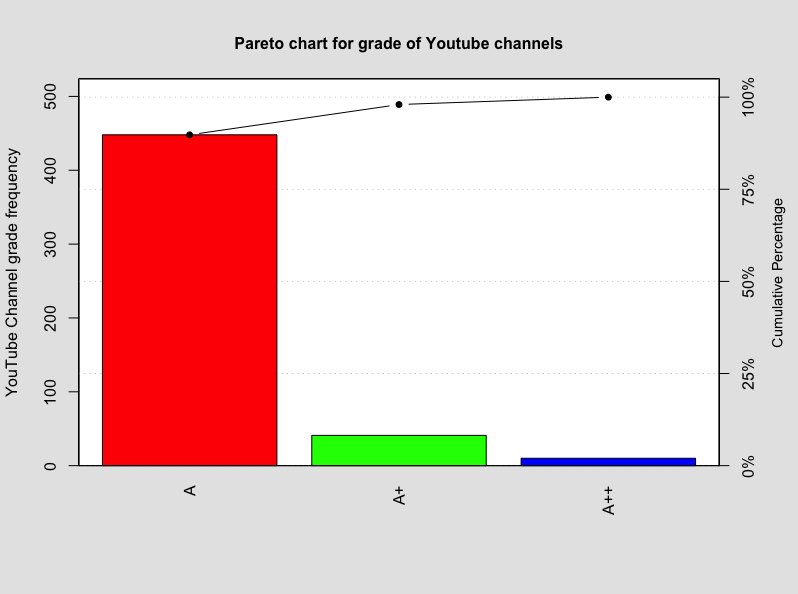
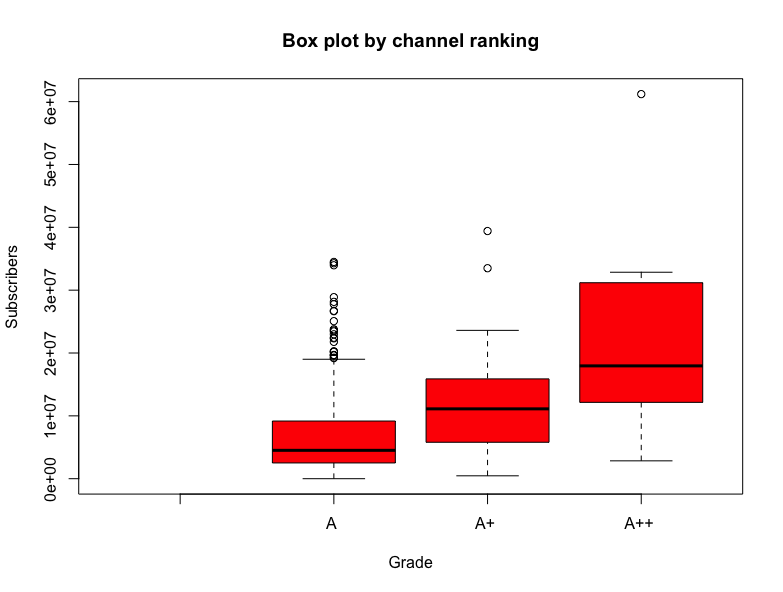
Pareto chart displaying the gradding of YouTube channels by Kaggle. Most of the top 500 videos have a rank of A
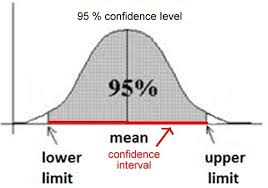
Confidence interval:
-
 Video views:
3463738730-4276711247 -
Subscribers:
6887852-8171726 -
Video uploads:
5517.512-9594.36
HYPOTHESIS TEST 1
Is there a difference in views between the YouTube channels that uploaded a lot of videos (over 10000) and the channels who uploaded less videos (under 10000)?. The test is a 0.05 confidence level.
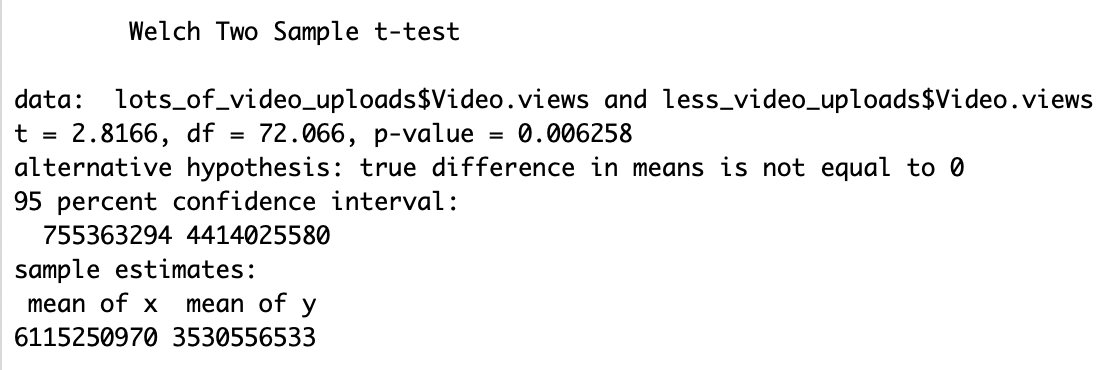
We can conclude at a 95% confidence level that there is a difference between the two means between the channels that upload a lot of videos (over 10000) and the ones who don’t (less than 10000).
HYPOTHESIS TEST 2
Is there a difference in Subscribers between the YouTube channels that uploaded a lot of videos (over 10000) and the channels who uploaded less videos(under 10000). The test is a 0.05 confidence level.
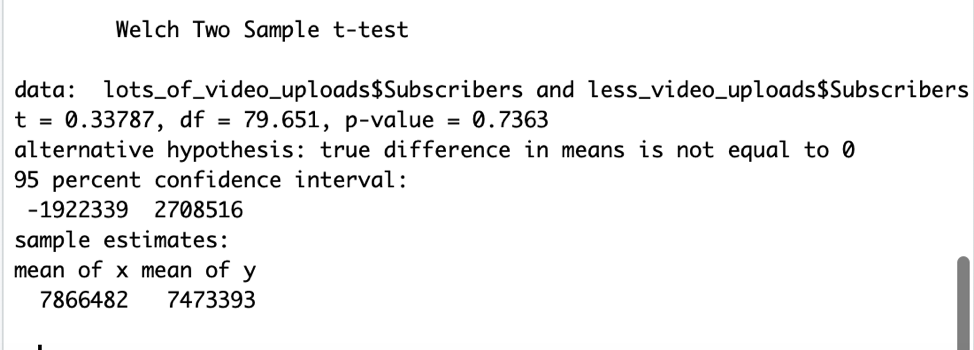
We can conclude at a 95% confidence level that there is not significance difference in the two means of the subscribers beetween the channels that upload a lot of videos (over 10000) and the ones who don’t (less than 10000).
HYPOTHESIS TEST 3
Is there a difference in video views between the YouTube channels that have more subscribers (over 10 million) and the channels who have less subscribers (less than 1 million). The test is a 0.05 confidence level.
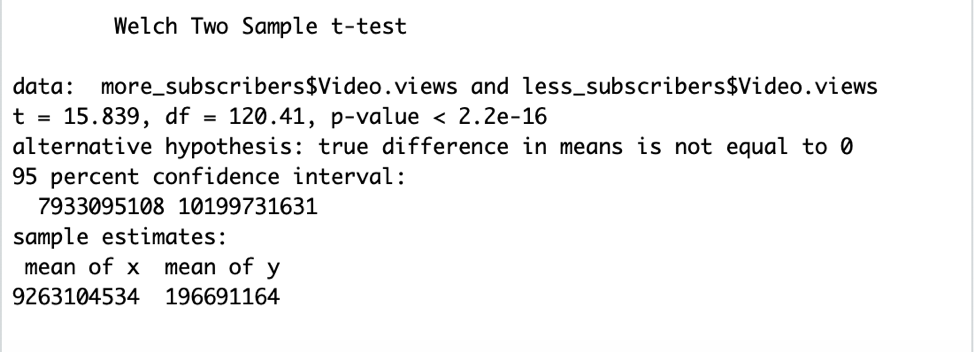
We can conclude at a 95% confidence level that there is evidence that there is a difference in views beetween the YouTube channels with more subscribers and the YouTube channels with less subscribers.
LINEAR MODEL
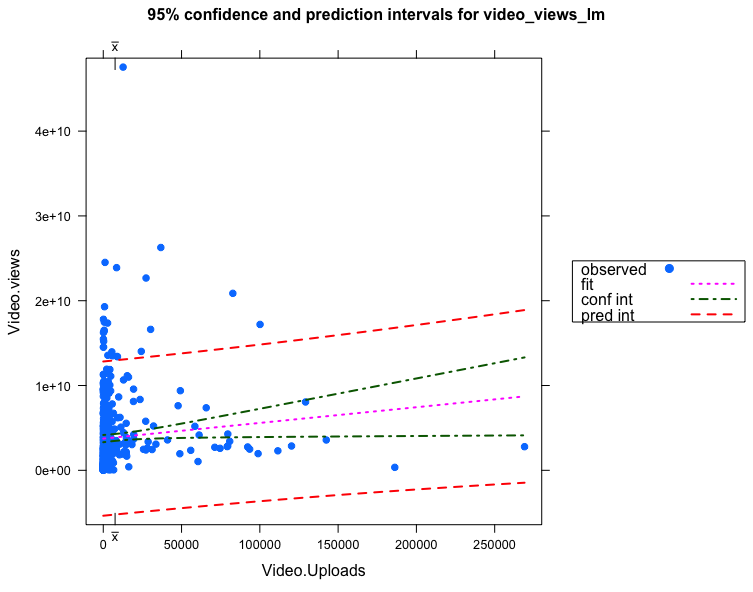
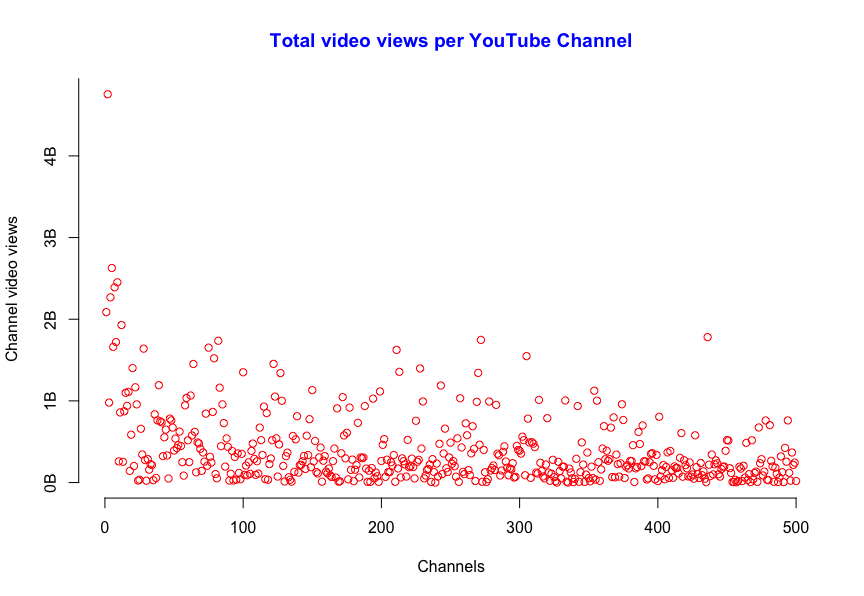
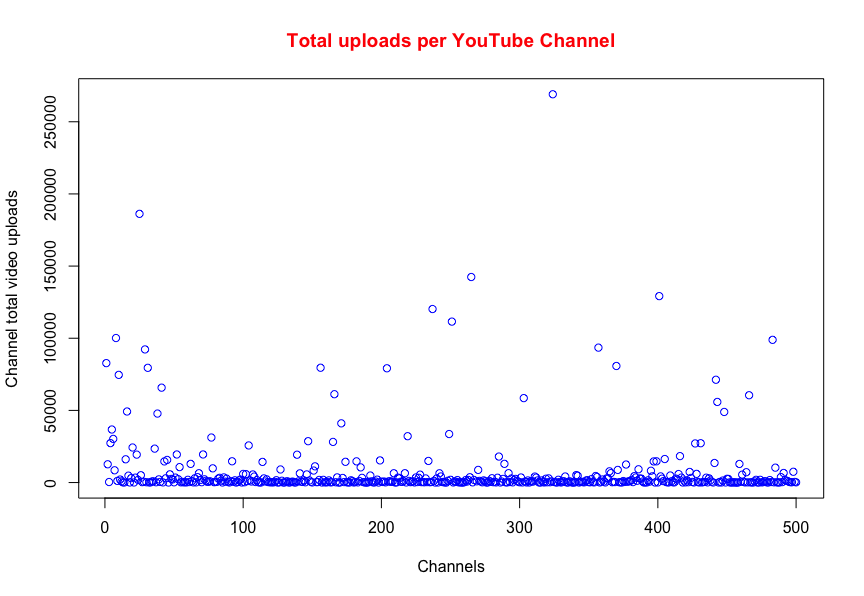
You don’t need a lot of videos on a channel to get more views. More video uploads don’t mean more views. Few videos uploads (like ~10,000 or something) is good enough to get a lot of views.
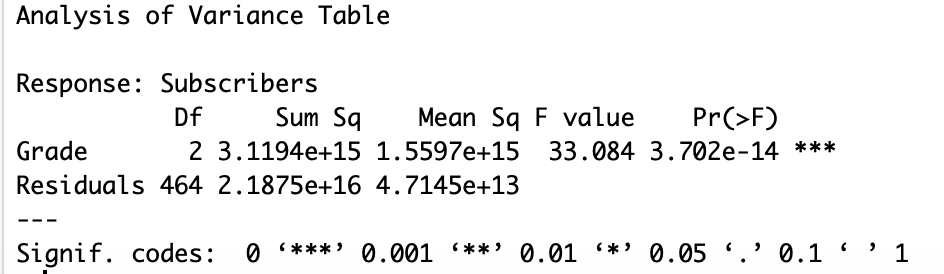
ANOVA